On this page
What Is Google Ads Conversion Rate?
Google Ads defines conversion rate as the average number of conversions per eligible ad interaction, expressed as a percentage.
An interaction depends on the ad format. It may be a click, view, swipe, call or another primary user action associated with the ad.
CONVERSION RATE DEPENDS ON YOUR CONVERSION SETUP
If you change which conversion actions are Primary, how they are counted, or what qualifies as a conversion, the reported conversion rate can change even if customer behavior does not.
Google Ads Conversion Rate Formula
The basic formula is:
FORMULA
Conversion Rate = Conversions / Eligible Ad Interactions x 100
Example: if a campaign records 50 conversions from 1,000 eligible interactions, the conversion rate is 5%.
Google notes that conversion rate can exceed 100% when multiple conversions can be counted from an interaction, such as when several conversion actions are tracked or an action uses the ‘Every’ counting method.
| Scenario | Conversions | Interactions | Conversion Rate |
|---|---|---|---|
| Simple lead campaign | 50 | 1,000 | 5.0% |
| Improved page, same traffic | 70 | 1,000 | 7.0% |
| Lower traffic, stronger intent | 60 | 600 | 10.0% |
| Multiple counted actions | 1,200 | 1,000 | 120% possible depending on setup |
Conversion Rate vs Conversions vs Cost per Conversion
| Metric | Question It Answers |
|---|---|
| Conversions | How many measured outcomes occurred? |
| Conversion Rate | How efficiently did eligible interactions turn into measured outcomes? |
| Cost per Conversion | How much ad spend was required per measured outcome? |
| Conversion Value | How much value was assigned to measured conversions? |
| Cost per Qualified Lead / CAC | How efficient was the campaign at producing real business outcomes? |
NEVER OPTIMIZE ONE METRIC ALONE
A higher conversion rate is valuable only when conversion volume, cost, quality and business value move in a healthy direction.
What Is a Good Google Ads Conversion Rate?
There is no single good Google Ads conversion rate that applies to every advertiser.
A useful benchmark must account for what is being advertised, what counts as a conversion, the campaign/channel, query intent, geography, device, audience, price point, funnel stage and lead/customer quality.
| Factor | Why CVR Changes |
|---|---|
| Conversion definition | Newsletter signup is easier than a purchase |
| Search intent | Brand/hire-now traffic can convert differently from research traffic |
| Industry | Buying cycles and economics differ |
| Offer/price | Risk and commitment affect conversion behavior |
| Campaign type | Search, Shopping, Display and PMax reach users differently |
| Device | Mobile and desktop experiences differ |
| Geography | Market familiarity, pricing and competition vary |
| Landing page | Message match and friction change behavior |
| Lead qualification | More friction can reduce raw CVR but improve quality |
BETTER BENCHMARK
Compare the campaign against its own mature historical baseline, business target and qualified outcome economics before comparing it with an internet average.
Why Industry Conversion Rate Benchmarks Can Mislead
Your keyword research shows meaningful demand for ‘average Google Ads conversion rate’ and ‘Google Ads conversion rate by industry.’ Those questions deserve an answer, but a benchmark table without methodology can create false precision.
- Third-party datasets use different advertiser samples.
- Some report leads; others report purchases or all conversions.
- Brand and non-brand traffic may be mixed.
- Geographies and devices may differ.
- Conversion tracking quality varies.
- Some accounts count micro-conversions that others exclude.
- Lead quality and revenue are rarely visible in public benchmark tables.
If JuvioX later publishes current industry benchmarks, they should be sourced, dated, geographically scoped and clearly separated by campaign/conversion type. This article deliberately avoids inventing a universal number.
Build Your Own Google Ads Conversion Rate Benchmark
1. Verify conversion tracking and Primary actions first.
2. Choose a meaningful period with enough mature conversion data.
3. Separate major campaign types and funnel stages.
4. Segment brand vs non-brand where relevant.
5. Review Search vs Shopping vs PMax vs Display separately.
6. Break out materially different devices, locations and offers.
7. Record raw CVR and qualified/customer CVR where possible.
8. Set a business target based on CPA/CAC, close rate and economics.
9. Use the resulting range as the account’s operating benchmark.
ACCOUNT-SPECIFIC BENCHMARK
A stable 6% conversion rate that produces profitable customers can be better than a 12% conversion rate built on weak leads.
Google Ads Conversion Rate by Campaign Type
| Campaign Type | Typical CVR Interpretation |
|---|---|
| Search | Strongly affected by query intent, match quality, ad promise and landing page |
| Shopping | Product relevance, price, feed quality, offer and checkout UX matter heavily |
| Performance Max | Cross-channel mix means conversion quality and reporting context are critical |
| Display | Often reaches less immediate demand; compare with appropriate objective/funnel stage |
| Video / Demand Gen | View/engagement context can differ from click-led Search behavior |
| Brand Search | Often converts differently from non-brand acquisition and should not define the whole account benchmark |
Do not use one account-wide conversion-rate average to diagnose every campaign.
The JuvioX Conversion Rate Diagnostic Framework
| Layer | Question | Typical Evidence |
|---|---|---|
| 1. Measurement | Is CVR mathematically trustworthy? | Tags, goals, counting, deduplication |
| 2. Traffic | Are the right users reaching the site? | Search terms, targeting, locations |
| 3. Message | Does the ad set the right expectation? | RSA assets, offer, qualification |
| 4. Page | Does the landing page continue intent? | Message match, UX, speed |
| 5. Friction | Can users complete the action easily? | Forms, checkout, errors |
| 6. Quality | Are conversions valuable? | CRM, qualified leads, revenue |
| 7. Bidding | Is Google optimizing toward the right signal? | Primary goals, Smart Bidding |
| 8. Experiment | Can the proposed fix be tested cleanly? | Hypothesis, experiment design |
DIAGNOSTIC ORDER
Do not redesign the landing page before confirming the traffic and conversion measurement. A page cannot fix irrelevant queries, and a campaign cannot optimize reliably from a broken conversion signal.
1. Traffic & Search Intent Quality
Conversion rate starts before the click. If traffic has weak commercial intent, the landing page is being asked to convert the wrong audience.
- Review Search Terms for informational, employment, support or unrelated intent.
- Separate brand and non-brand performance where useful.
- Use negative keywords for clearly irrelevant demand.
- Review match types and Broad Match expansion with conversion-quality context.
- Check location targeting and actual user geography.
- Compare query themes that produce customers vs raw conversions.
- For PMax, use current search-term/search-insight and channel reporting where available.
CRO BEGINS WITH ACQUISITION QUALITY
Sometimes the fastest conversion-rate improvement is not a page change – it is removing traffic that should never have reached the page.
2. Ad Copy, Offer & Message Match
Ads pre-frame the conversion. If the ad promises something the page does not deliver, users must reinterpret the offer after the click.
- Match the ad to the query’s real intent.
- Use specific offers rather than vague marketing language.
- Qualify price, geography or customer type when appropriate.
- Align CTA language between ad and landing page.
- Avoid clickbait headlines that inflate CTR but reduce CVR.
- Use proof and differentiators that continue on the destination page.
A slightly lower CTR can be acceptable when ad qualification increases conversion rate and downstream lead/customer quality.
3. Landing Page Conversion Rate Optimization
The landing page should answer three questions quickly: Am I in the right place? Is this offer credible? What should I do next?
| Page Element | CRO Job |
|---|---|
| Hero | Confirm intent and value |
| CTA | Make the next action obvious |
| Proof | Reduce perceived risk |
| Offer detail | Answer decision-critical questions |
| Process | Reduce uncertainty |
| Qualification | Filter poor-fit users when needed |
| FAQ | Resolve objections |
| Mobile UX | Remove device friction |
| Speed/stability | Prevent technical abandonment |
4. Forms, Checkout & Conversion Friction
| Friction Problem | What to Check |
|---|---|
| Long form | Does every field support qualification/routing? |
| Low-quality leads | Would purposeful qualification improve sales efficiency? |
| Form abandonment | Errors, validation, mobile input, privacy concerns |
| Checkout abandonment | Shipping, payment, trust, unexpected costs |
| Call conversion | Phone visibility, hours, answer rate |
| Booking abandonment | Calendar availability, timezone, too many steps |
LESS FRICTION IS NOT ALWAYS BETTER
Removing every field can raise raw CVR and lower lead quality. Optimize for the business outcome, not merely form completion.
5. Lead Quality & Downstream Conversion Rate
For lead generation, page CVR is only the first conversion rate in the funnel.
| Funnel Stage | Useful Rate |
|---|---|
| Click -> Lead | Raw Google Ads conversion rate |
| Lead -> Qualified Lead | Qualification rate |
| Qualified Lead -> Opportunity | Opportunity rate |
| Opportunity -> Customer | Close rate |
| Click -> Customer | True acquisition conversion rate |
If raw CVR rises while qualification rate collapses, the CRO change may be harmful.
MEASURE BOTH
Pair Google Ads CVR with cost per qualified lead, opportunity rate, CAC and revenue where possible.
6. Tracking Problems That Distort Conversion Rate
- Duplicate conversion tags
- Counting button clicks instead of successful submissions
- Incorrect ‘Every’ vs ‘One’ counting
- Multiple Primary actions representing the same outcome
- Missing purchase transaction IDs/deduplication
- GA4 and native Ads actions both used unintentionally for bidding
- Consent or tag firing issues
- Cross-domain/session problems
- Thank-you pages reachable without completing the action
- Offline/CRM conversions mapped to the wrong action
Conversion rate optimization should not begin until the denominator and numerator are understood.
7. Device, Location, Audience & Time Segments
An account-wide average can hide segments with very different behavior.
- Compare mobile vs desktop CVR and qualified outcomes.
- Review location performance against serviceability and economics.
- Check day/hour patterns if response time or availability affects conversion.
- Compare new vs returning users carefully where the campaign/report supports it.
- Review landing pages by campaign and device rather than assuming one page behaves the same everywhere.
DO NOT OVER-SEGMENT TINY DATA
Segment to find meaningful patterns, but avoid making major decisions from a handful of conversions.
8. Bidding Strategy and Conversion Rate
Smart Bidding uses conversion probability/value signals at auction time, but it optimizes toward the conversion goals you provide.
A bidding change can alter traffic composition and therefore observed conversion rate. For example, a strategy focused on conversion volume may enter auctions differently from one constrained by Target CPA or optimized for conversion value.
DO NOT OPTIMIZE SMART BIDDING FOR CVR DIRECTLY
The goal is not the highest conversion-rate percentage. The goal is the best volume/value at acceptable CPA/ROAS using trustworthy conversion signals.
How to Improve Google Ads Conversion Rate: 12 High-Leverage Actions
1. Verify conversion tracking and remove duplicate/weak Primary actions.
2. Analyze Search Terms and eliminate clearly irrelevant intent.
3. Separate materially different offers or funnel stages.
4. Improve ad-to-page message match.
5. Send traffic to the most relevant landing page.
6. Clarify the value proposition above the fold.
7. Make the primary CTA specific and obvious.
8. Remove unnecessary form/checkout friction.
9. Add purposeful qualification when low-quality leads are the problem.
10. Improve mobile usability, speed and technical stability.
11. Feed qualified/customer outcomes back into Google Ads where possible.
12. Test meaningful hypotheses rather than making uncontrolled simultaneous changes.
Google Ads A/B Testing: What It Should Actually Mean
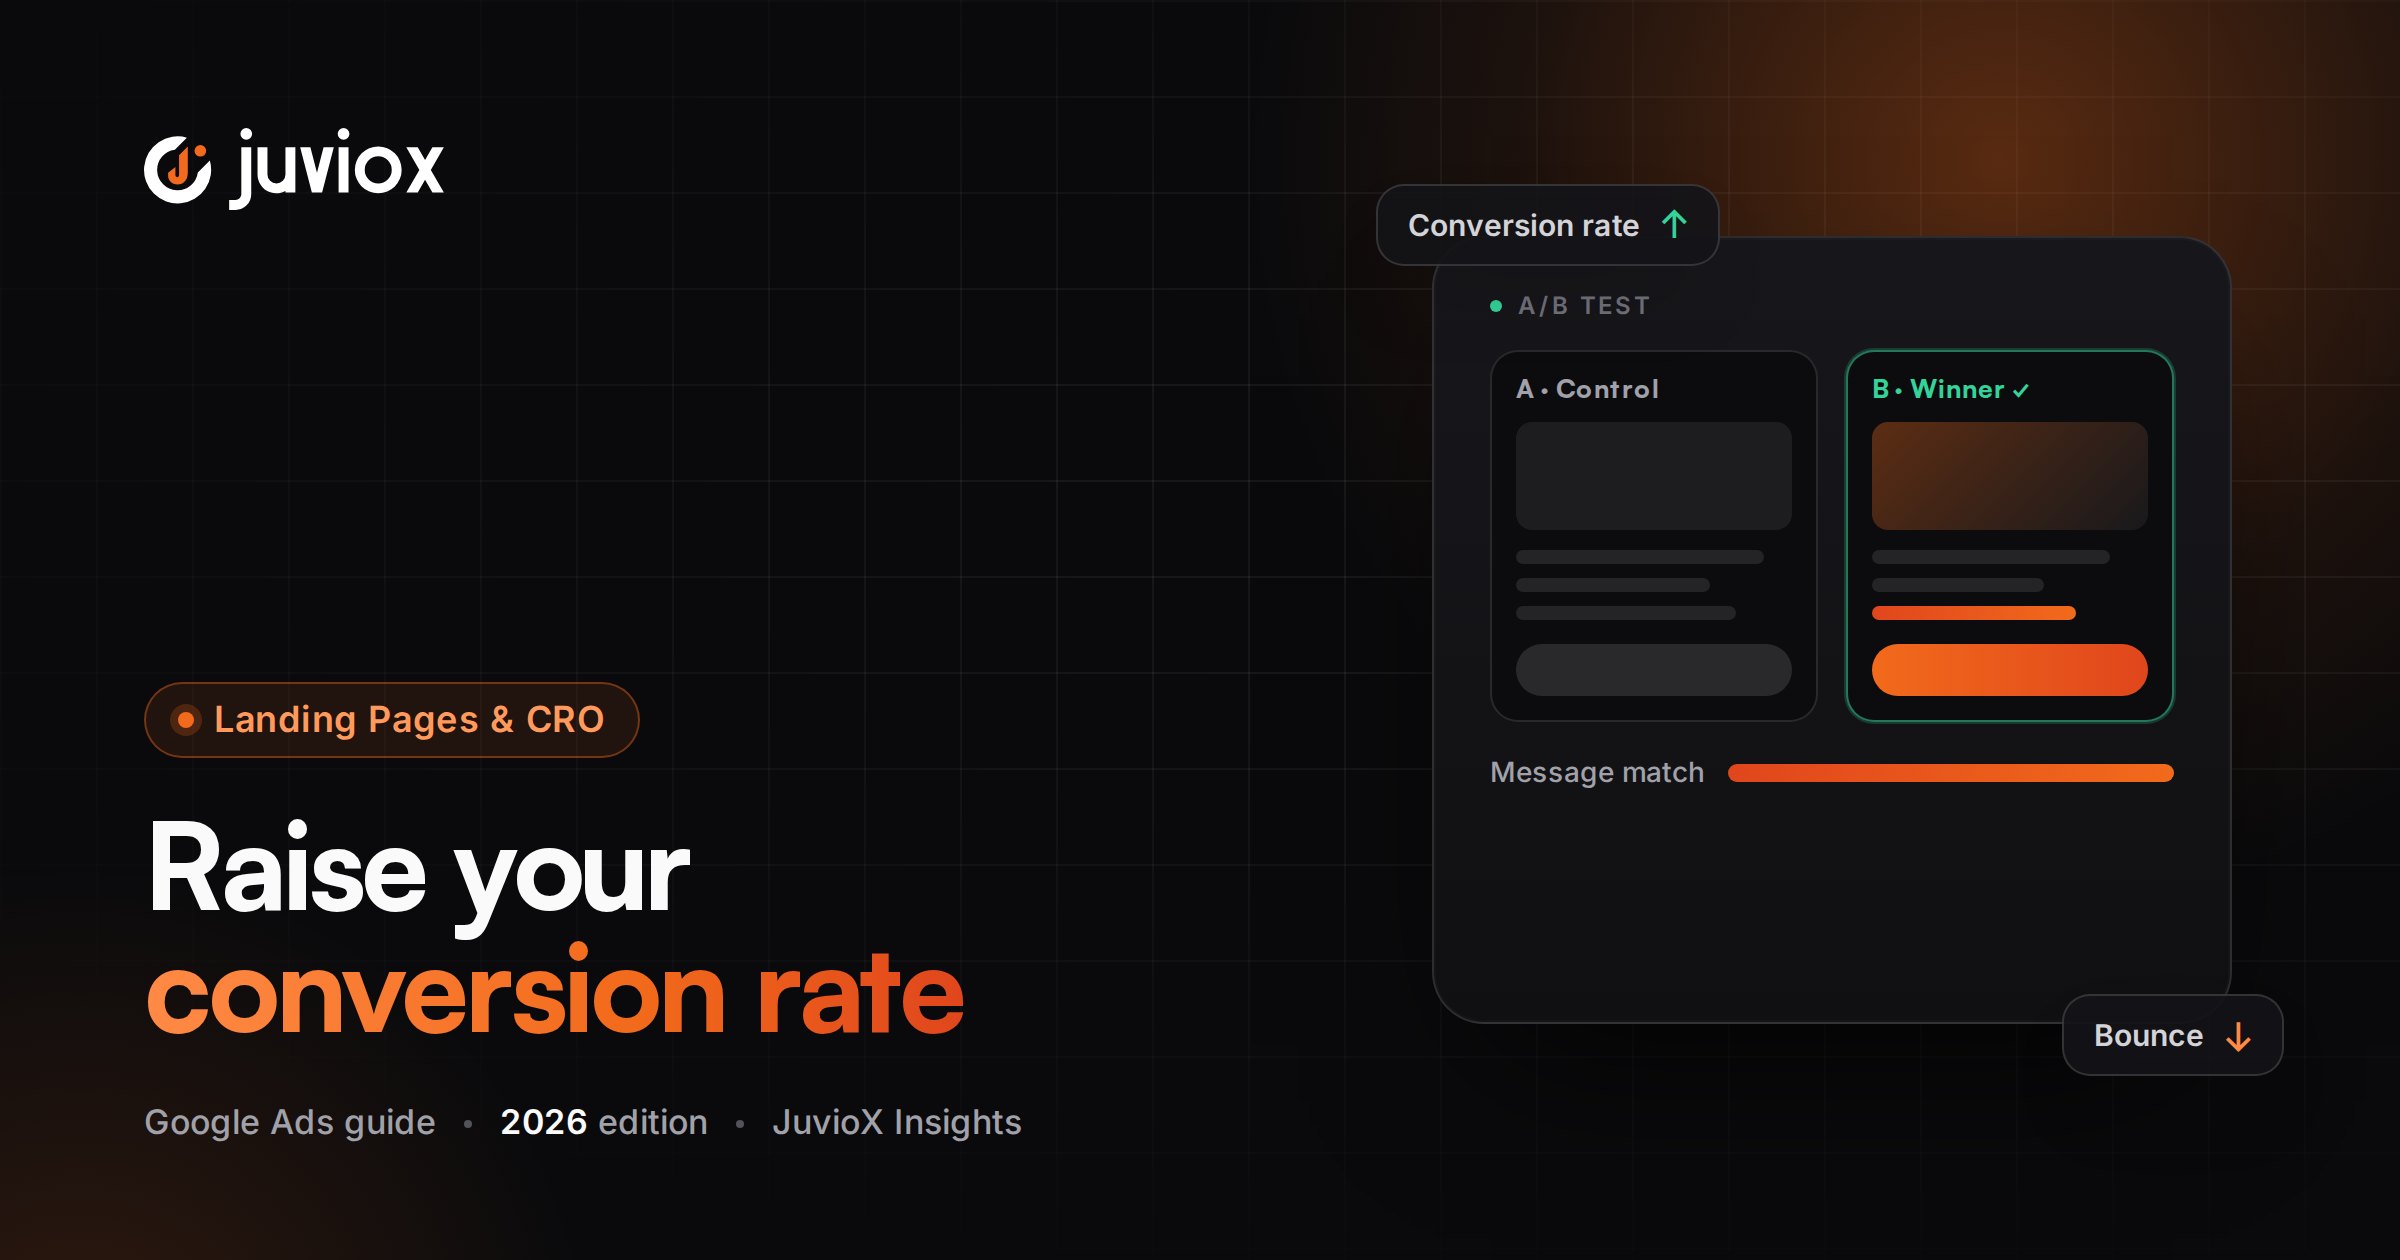
A/B testing compares a control with a treatment so you can estimate whether a specific change improved the selected outcome.
In Google Ads, testing can happen through platform experiments, ad variations, landing-page testing tools, or carefully controlled external experiments.
A TEST NEEDS A HYPOTHESIS
‘Try a new landing page’ is not a useful hypothesis. ‘Removing the mandatory phone field will increase completed demo requests without materially reducing qualified-lead rate’ is testable.
Google Ads Experiments in 2026
Google Ads’ Experiments area supports multiple experiment types, including ad variations, custom Search/Display experiments, AI Max experiments, Performance Max experiments, Demand Gen experiments, Video experiments and other supported tests.
Google says custom experiments can be used to test settings such as Smart Bidding, keyword match types, landing pages, audiences and ad groups.
| Experiment Type | Useful CRO / Conversion Use |
|---|---|
| Ad variations | Test RSA creative/message changes |
| Custom Search experiment | Test landing page, bidding, match type, audience or campaign setting |
| AI Max experiment | Test AI Max Search features using a controlled split |
| Performance Max experiment | Test PMax features/settings/campaign impact |
| Video experiment | Compare video creative against conversion or lift objectives where supported |
CURRENT PLATFORM CHANGE
Google’s Experiments interface continues to expand. Use the experiment type that isolates the variable you actually want to learn about rather than forcing every test into a manual A/B setup.
How to Design a Better Google Ads Experiment
1. Write one business hypothesis.
2. Choose one primary success metric before launch.
3. Change one variable or one coherent concept.
4. Keep conversion tracking stable.
5. Choose campaigns with enough volume to learn.
6. Use a traffic split that gives the treatment meaningful exposure.
7. Avoid unrelated base-campaign changes during the test.
8. Account for Smart Bidding ramp-up and conversion delay.
9. Let the test reach sufficient duration/power.
10. Judge the business metric, not the prettiest chart.
11. Document the result, including inconclusive tests.
Google’s experiment guidance explicitly recommends a clear hypothesis, one variable at a time, and pre-selecting the success metric.
Experiment Power: Why Many A/B Tests Never Produce a Clear Answer
A low-volume campaign may not generate enough observations to distinguish a real improvement from normal variation.
Google now provides Campaign Guidance / Experiment Power for supported Search and Performance Max experiment types. The score estimates the likelihood of achieving statistically significant results based on factors such as historical spend/conversions, expected uplift, traffic split and duration.
| Experiment Power | Google’s Current Range |
|---|---|
| Low | 0-49% |
| Medium | 50-79% |
| High | 80-99% |
POWER IS AN ESTIMATE
A high power score does not guarantee a winner, and a low score does not prove the idea is bad. It tells you whether the experiment design is likely to answer the question.
How Long Should a Google Ads Experiment Run?
There is no universal seven-day rule. Duration depends on traffic, conversion volume, conversion delay, variability, experiment type and the size of the effect you are trying to detect.
Google’s general Experiments guidance says that when results remain In Progress, Undecided or Unavailable, allowing at least 4-6 weeks can provide more data. For Smart Bidding tests, Google publishes more specific ramp-up and evaluation guidance that can require multiple conversion cycles and an uninterrupted evaluation period.
AVOID WEEKDAY-VS-WEEKEND WINNERS
Do not stop a test after a few conversions because one arm looks better. Let the design, power and conversion maturity determine when the result is interpretable.
Landing Page Split Testing With Google Ads Traffic
Landing-page tests should preserve traffic comparability. If Version A receives mostly brand traffic and Version B receives mostly non-brand traffic, the page comparison is invalid.
- Split comparable users/traffic randomly where possible.
- Keep campaign targeting and ad message consistent unless those are part of the hypothesis.
- Keep tracking identical across variants.
- Use the same conversion definition.
- Monitor qualified/customer outcomes, not only page CVR.
- Check device and page-speed differences.
- Avoid SEO/indexing issues when using test URLs.
- Do not route users through slow or unreliable redirect chains.
TESTING TOOLS
External CRO platforms such as Unbounce may be used for page creation/testing, but the methodology matters more than the tool.
What Should You Test First?
| Priority | Test Area | Why |
|---|---|---|
| 1 | Broken tracking / funnel errors | No optimization is valid until measurement works |
| 2 | Traffic-intent mismatch | Wrong users cannot be CRO’d into the right users |
| 3 | Offer / message match | Large behavioral impact |
| 4 | Hero/value proposition | Immediate comprehension |
| 5 | Form/checkout friction | Direct conversion barrier |
| 6 | Trust/proof/objection handling | Reduces decision risk |
| 7 | Mobile UX / speed | Can remove technical abandonment |
| 8 | Micro design details | Useful after larger problems are addressed |
DO NOT START WITH BUTTON COLORS
High-leverage CRO usually comes from intent, offer, message, friction and trust before cosmetic micro-tests.
A CRO Measurement Hierarchy for Google Ads
| Level | Metric | Decision |
|---|---|---|
| Traffic | Clicks / interactions / search terms | Are we buying the right demand? |
| Page | Conversion rate | Does the post-click experience work? |
| Efficiency | CPA / CPL | What does the measured outcome cost? |
| Quality | Qualified conversion rate / CPQL | Are conversions commercially useful? |
| Pipeline | Opportunity rate / cost per opportunity | Does sales progress? |
| Customer | CAC / customers | Are we acquiring buyers? |
| Economics | Revenue / profit / ROAS | Does growth create value? |
CRO NORTH STAR
The objective is not maximum CVR. It is maximum profitable/qualified output from the available traffic and budget.
The JuvioX Google Ads CRO Optimization Loop
1. Measure: verify conversion actions and business outcomes.
2. Diagnose: identify the biggest drop-off or quality problem.
3. Prioritize: estimate impact, confidence and effort.
4. Hypothesize: state why a specific change should improve the outcome.
5. Test: isolate the change where practical.
6. Evaluate: account for conversion delay and statistical uncertainty.
7. Validate downstream: check quality, sales and revenue.
8. Deploy: apply the winner or keep the control.
9. Document: record what was learned.
10. Repeat: move to the next highest-value constraint.
Google Ads Conversion Rate Optimization Checklist
- Primary conversion actions verified
- Counting method reviewed
- Duplicate conversions excluded
- Brand/non-brand context understood
- Campaign types benchmarked separately
- Search Terms reviewed
- Negative keywords reviewed
- Ad message matches intent
- Landing page matches ad promise
- Mobile UX tested
- Page speed/stability reviewed
- CTA is specific
- Form/checkout errors tested
- Form fields have a purpose
- Qualified lead/customer outcomes available where possible
- Device/location segments reviewed
- Smart Bidding goal matches business objective
- Conversion delay understood
- Experiment hypothesis written
- Primary experiment metric chosen before launch
- One meaningful variable isolated
- Traffic split/duration sufficient
- Base campaign kept stable during experiment
- Downstream quality checked before declaring winner
- CRO learnings documented
Common Google Ads Conversion Rate Mistakes
| Mistake | Why It Misleads | Better Approach |
|---|---|---|
| Chasing a universal benchmark | Account contexts differ | Build an account-specific baseline |
| Optimizing only CVR | Can reward low-value conversions | Pair with CPA/quality/revenue |
| Counting weak micro-conversions as Primary | Inflates apparent success | Use meaningful business goals |
| Changing traffic and page together | Cannot identify the cause | Isolate major variables |
| Stopping tests early | Normal variance looks like a winner | Use adequate duration/power |
| Testing too many things at once | No causal learning | One variable/coherent concept |
| Ignoring conversion delay | Recent data looks artificially weak | Wait for mature outcomes |
| Comparing tiny segments | Random noise dominates | Require sufficient data |
| Assuming landing page is always the problem | Traffic may be irrelevant | Diagnose acquisition first |
| Using CTR as CRO success | Click quality can decline | Judge conversion/business outcome |
| Publishing old benchmark tables as truth | Datasets age and definitions differ | Date/source/qualify any benchmarks |
Final Takeaway: Improve the System, Not Just the Percentage
Google Ads conversion rate is a useful efficiency metric, but it is not the business objective. The percentage only becomes meaningful when the conversion definition, traffic quality and downstream economics are trustworthy.
Start with measurement. Diagnose the traffic. Align the ad and landing page. Remove unnecessary friction. Protect lead/customer quality. Then test the highest-impact hypothesis with enough data to learn.
The strongest Google Ads CRO program does not ask only, ‘How do we get a higher conversion rate?’ It asks, ‘How do we turn more of the right paid traffic into profitable customers – and prove which changes actually caused the improvement?’
GOOGLE ADS + WEB DESIGN & CRO
Improve Conversion Rate Without Sacrificing Lead or Customer Quality
JuvioX connects paid-traffic quality, landing-page CRO, conversion tracking and controlled testing so optimization is measured against qualified business outcomes.
FAQ
Frequently asked questions
What is Google Ads conversion rate?
It is the average number of conversions per eligible ad interaction, expressed as a percentage.
How do you calculate Google Ads conversion rate?
Divide conversions by eligible ad interactions and multiply by 100. For example, 50 conversions from 1,000 interactions equals a 5% conversion rate.
Can Google Ads conversion rate be over 100%?
Yes. Google notes this can happen when more than one conversion can be counted per interaction, such as with multiple conversion actions or the 'Every' counting method.
What is a good Google Ads conversion rate?
There is no universal number. A good rate is one that produces sufficient qualified conversions or revenue at acceptable economics for your campaign, offer and market.
What is the average Google Ads conversion rate?
Public averages vary by dataset, industry, geography, campaign type and conversion definition. Use a current sourced benchmark only as context, then compare against your own mature baseline.
Why is my Google Ads conversion rate low?
Common causes include weak search intent, irrelevant traffic, ad/page mismatch, poor offer, landing-page friction, mobile/speed issues, broken tracking or an overly difficult conversion action.
How can I increase Google Ads conversion rate?
Improve traffic quality, message match, landing-page relevance, CTA clarity, form/checkout usability, mobile performance and conversion measurement, then validate major changes with experiments.
Does a higher conversion rate always mean better Google Ads performance?
No. CVR can rise while conversion quality or revenue falls. Always compare cost, qualified outcomes and customer economics.
What is Google Ads conversion rate optimization?
It is the systematic process of improving the percentage and quality of ad interactions that become valuable outcomes through targeting, messaging, landing pages, forms, measurement and testing.
Can I A/B test in Google Ads?
Yes. Google Ads provides an Experiments area with multiple test types, including ad variations, custom experiments, AI Max experiments and Performance Max experiments where eligible.
Can I A/B test Google Ads landing pages?
Yes. Landing pages can be tested through supported custom experiments or external CRO testing setups, provided comparable traffic and consistent measurement are maintained.
How long should a Google Ads A/B test run?
There is no universal duration. It depends on traffic, conversions, conversion delay, variability and expected uplift. Google's general guidance can require 4-6 weeks when results remain inconclusive.
What is Experiment Power in Google Ads?
For supported experiments, it is an estimate of the likelihood that the experiment can achieve a statistically significant result based on historical data, traffic split, duration and expected uplift.
Should I test one thing at a time?
For causal learning, yes. Google recommends testing one variable at a time so you can identify what drove the result.
Should I optimize for conversion rate or cost per conversion?
Neither in isolation. Use CVR and CPA together, then validate qualified leads, customers, revenue or profit.
Does Smart Bidding improve conversion rate?
Smart Bidding can change traffic composition based on predicted conversion/value likelihood, but its objective is the chosen conversion/value goal rather than maximizing the CVR percentage itself.
What should I test first if my conversion rate is low?
First verify tracking and traffic quality. Then prioritize large constraints such as offer/message match, landing-page clarity, form friction, mobile UX and trust before cosmetic micro-tests.
8 sources & references
- Google Ads Help - Conversion rate definition
- Google Ads Help - Understand conversion tracking data
- Google Ads Help - About the Experiments page
- Google Ads Help - Test with confidence with the Experiments page
- Google Ads Help - Set up a custom experiment
- Google Ads Help - Build better experiments with Campaign Guidance / Experiment Power
- Google Ads Help - Test your bid strategy
- Google Ads Help - Conversion tracking definition